Objectif
We employ a multiple index model to investigate how the infection fatality rate (IFR) of COVID-19 is associated with possible geographical or demographical features of the infected population for each province in Canada. To identify the possible risk factors for the infection fatality rate of COVID-19, we utilize an adaptive Lasso penalized sliced inverse regression method, which achieves variable selection and sufficient dimension reduction simultaneously with unimportant features removed automatically. We apply the proposed method to analyze the COVID-19 data that are obtained from time point May 4th, 2020 for each province in Canada.
Assumption and Model
The infection fatality rate (IFR) in percent of the COVID-19 is defined as

The number of deaths and confirmed cases are taken from time point May 4th, 2020. The data of the features for each province are displayed in Table 1, which are available from public data sources.

Table 1: Dictionary of Features. CCDSS and CTADS represent the Canadian Chronic Disease Surveillance System and the Canadian Tobacco, Alcohol and Drugs Survey.
Detailed descriptions of the features are as follows:
- Number of seniors: the number of residences age 65 or over.
- Average temperature: the average temperature from February to April.
- Ischemic heart disease: the age standardized incidence rate of the ischemic heart disease per 100,000 people for both sexes age 20 years and older.
- Number of physicians: the number of family medicine and general practice physicians.
- Number of hospital establishments: the number of hospital establishments in each province.
- Relative humidity: the average relative humidity from February to April.
- Smoking prevalence: the smoking prevalence in each province which includes daily and non-daily smokers.
- Acute myocardial infarction: the age standardized incidence rate of the acute myocardial infarction per 100,000 people for both sexes age 20 years and older.
- Hypertension: the age standardized incidence rate of the hypertension per 100,000 people for both sexes age 20 years and older.
Findings and Discussion
The analysis results are recorded in Table 2. According to the results of linear regressions method, there is no significant features if we take the significant level to be 0.05. The analysis results of the multiple index model suggest that the number of seniors, the number of physicians and the number of hospital establishments have strong association with the IFR of the COVID-19 for each province, while the rest of the features do not associate with the IFR. We need to mention that the results are obtained based on the current available data with limited sample size. Since the data resources are limited and the outbreak of the COVID-19 is still growing, studies with more data are needed to better understand the characteristics of the COVID-19.
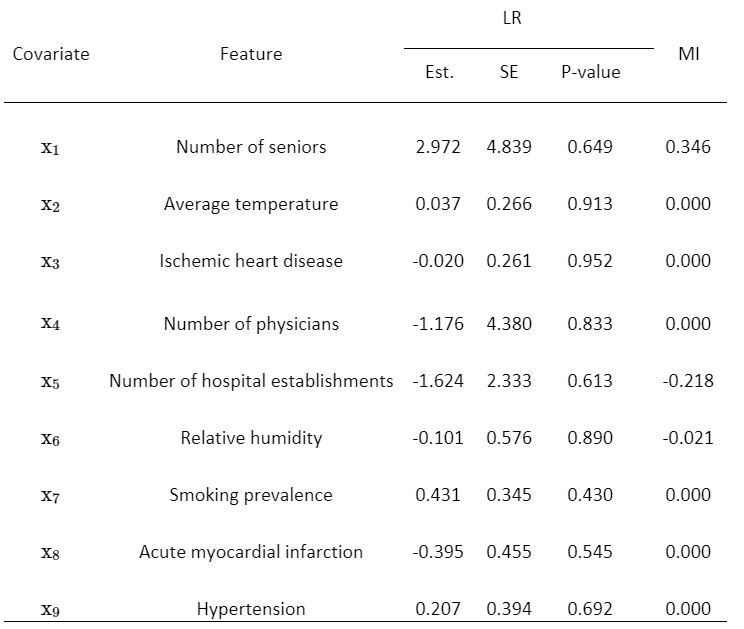
Table 2: Data analysis results from the linear regressions (LR) and multiple index model (MI), Est. and SE represent the estimate and standard error. The values of "Est." and "SE" are divided by 1e+10.